* Note:
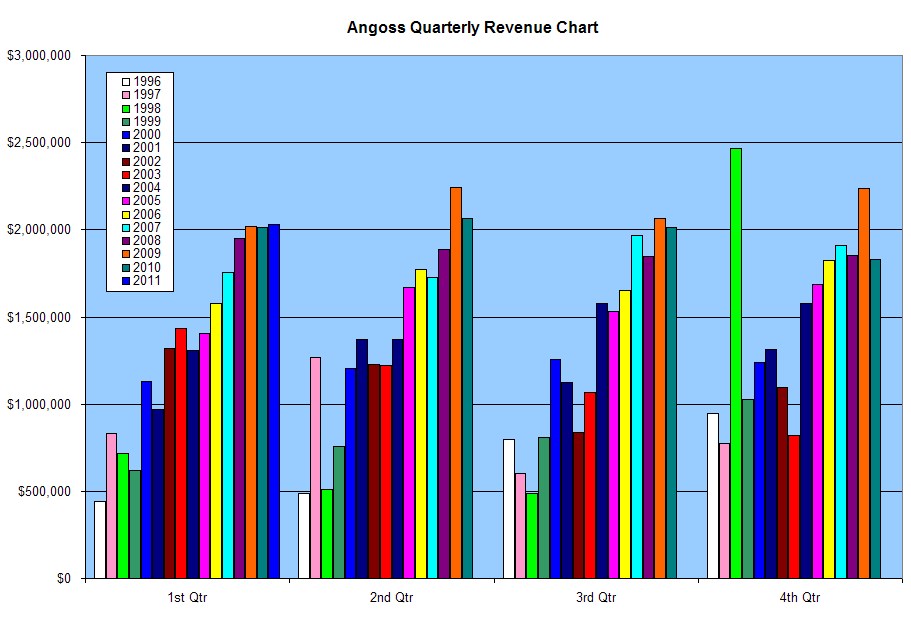
Angoss Adopted EIC-142 Accounting Principles in 2006. 2004-2006 results have been
restated in chart above and table below
|
Year |
1st Qtr |
2nd Qtr |
3rd Qtr |
4th Qtr |
|
1996 |
$443,622 |
$489,537 |
$794,589 |
$946,413 |
|
1997 |
$833,896 |
$1,266,387 |
$603,010 |
$775,618 |
|
1998 |
$716,680 |
$512,717 |
$485,344 |
$2,468,434 |
|
1999 |
$620,775 |
$756,341 |
$811,605 |
$1,026,088 |
|
2000 |
$1,130,744 |
$1,202,142 |
$1,258,967 |
$1,240,292 |
|
2001 |
$967,797 |
$1,372,056 |
$1,125,665 |
$1,315,342 |
|
2002 |
$1,317,860 |
$1,225,454 |
$838,973 |
$1,092,994 |
|
2003 |
$1,433,961 |
$1,221,092 |
$1,065,174 |
$821,490 |
|
2004 |
$1,305,935 |
$1,372,111 |
$1,579,621 |
$1,579,447 |
|
2005 |
$1,406,114 |
$1,667,806 |
$1,529,796 |
$1,685,300 |
|
2006 |
$1,574,610 |
$1,771,168 |
$1,652,517 |
$1,825,819 |
|
2007 |
$1,757,979 |
$1,726,657 |
$1,965,009 |
$1,911,831 |
|
2008 |
$1,953,037 |
$1,888,807 |
$1,844,573 |
$1,855,106 |
|
2009 |
$2,020,967 |
$2,244,549 |
$2,067,775 |
$2,239,017 |
|
2010 |
$2,013,266 |
$2,067,845 |
$2,012,993 |
$1,827,942 |
|
2011 |
$2,032,652 |
|
|
|